Chris Lyman
Power BI Developer

Portfolio – Recent Visualization Projects
Sensitive information has been obscured.
Platform: Power BI with live connection to database.
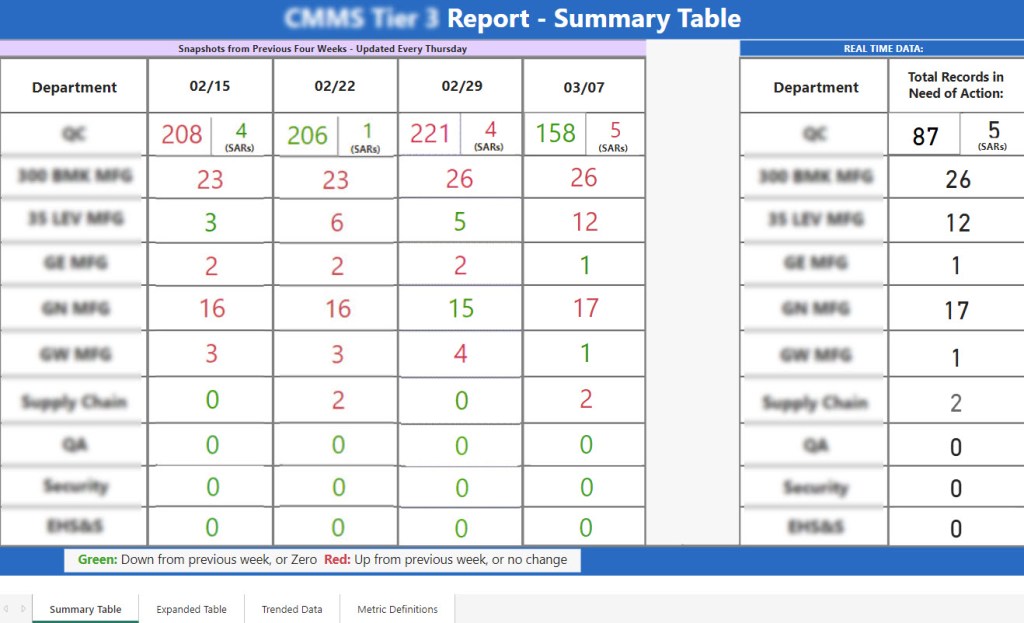
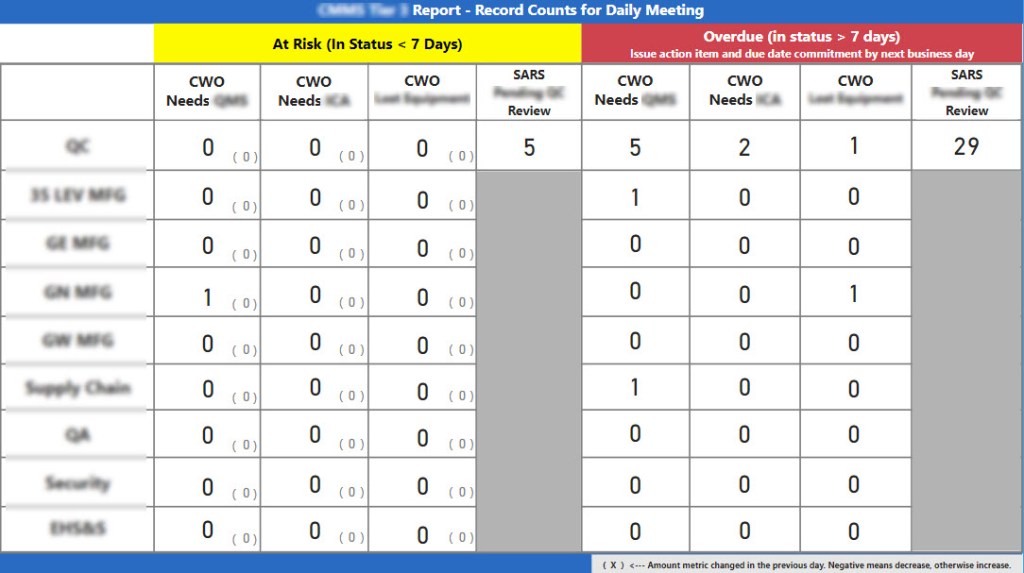
Tier 3 Leadership Report that displays total outstanding records within the application, by department. Record counts are compiled from eight tables / types of records, with many sub-criteria for each type taken into account.
Platform: Power BI with live connection to database.
Platform: Power BI with live connection to database.
Platform: Power BI with live connection to database.

Platform: Power BI with live connection to database.
Platform: Power BI with live connection to database.
Platform: Power BI with live connection to database.

Second Tab of Tier 3 Leadership Report that breaks outstanding record counts out by type, to allow Leadership team to identify areas with greatest need of attention.
Platform: Power BI with live connection to database.

Platform: Power BI with live connection to database.
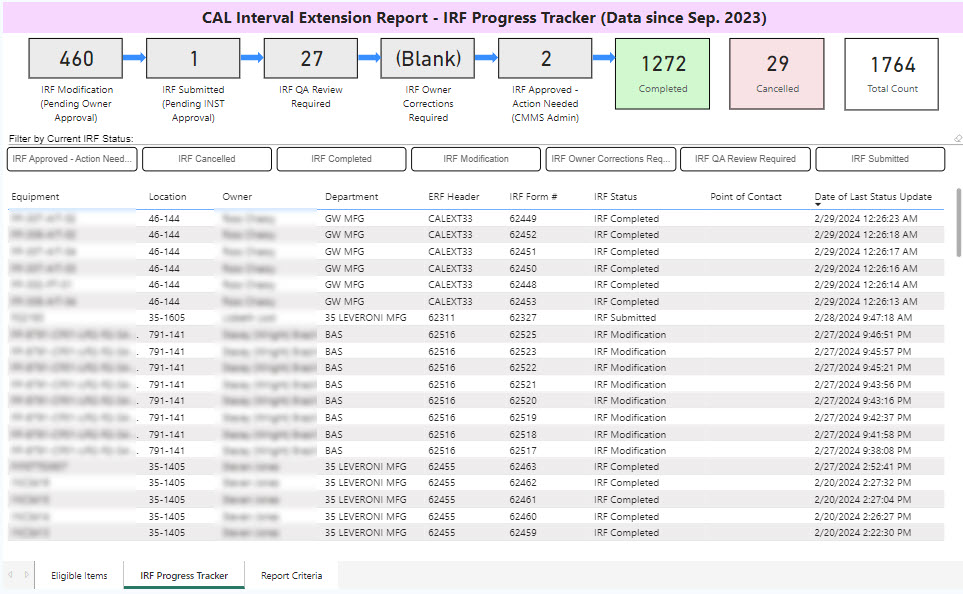
Report displays equipment that meets 17 criteria of varying complexity, which allows for maintenance interval of equipment to be extended. Report then tracks progress of all maintenance extension requests, allowing significant cost savings.
Platform: Power BI with live connection to database.
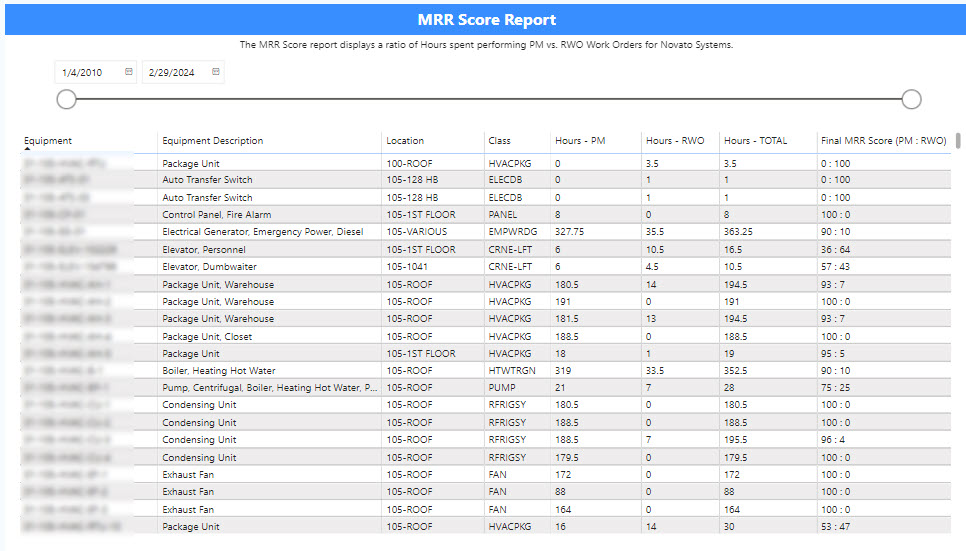
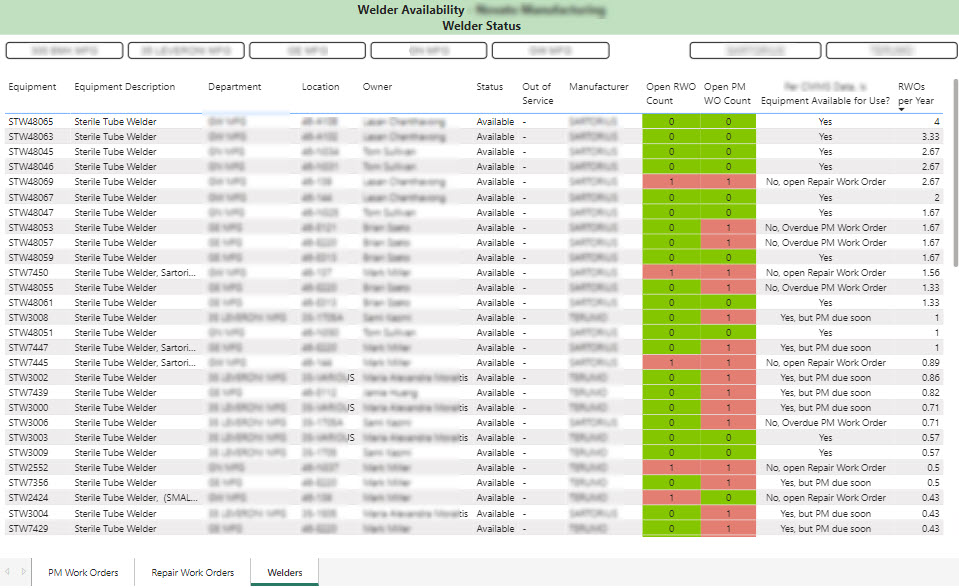
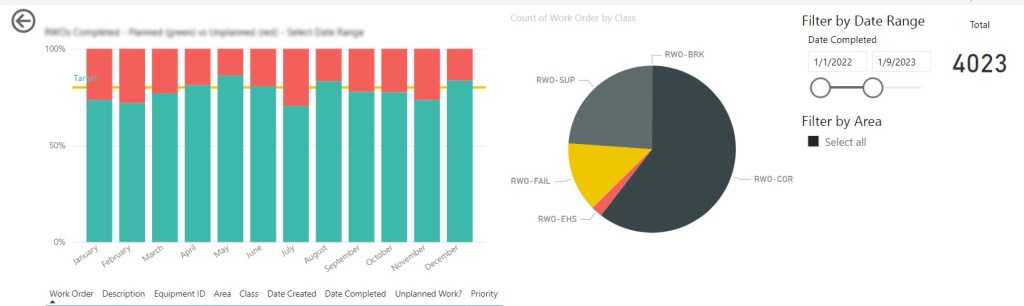
Report displays ratio of maintenance work (planned, preventative) vs. repair work (unexpected, break) for all equipment. Allows for identification of ‘problem’ equipment with high rates of failure compared to maintenance. Equipment is then replaced, creating cost savings and improving reliability.
Platform: Power BI with live connection to database.
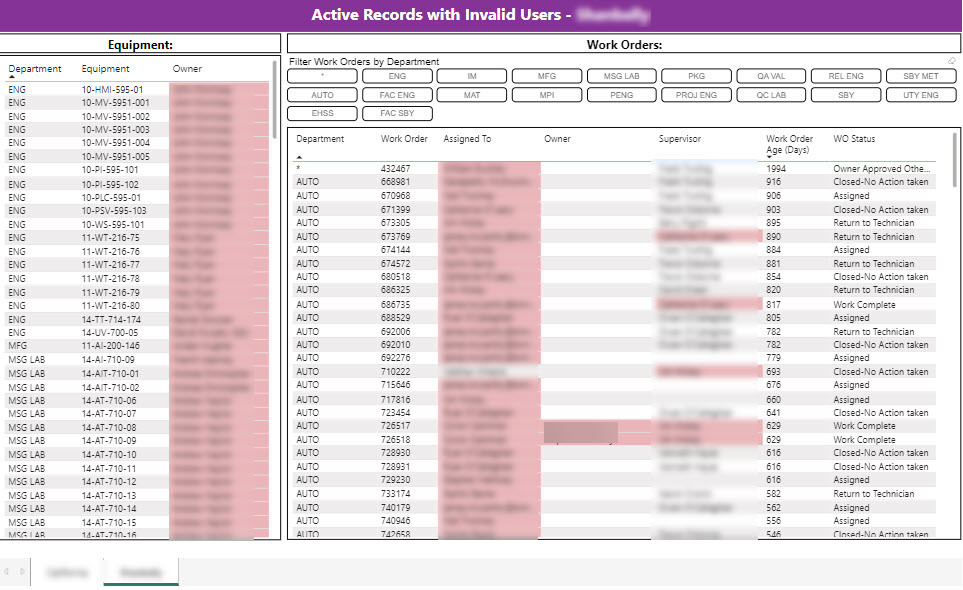
Report displays all active records in the system from across every possible type, that are associated with an inactive user. Enables Administrator to easily perform remediation and maintain data integrity.
Platform: Power BI with live connection to database.
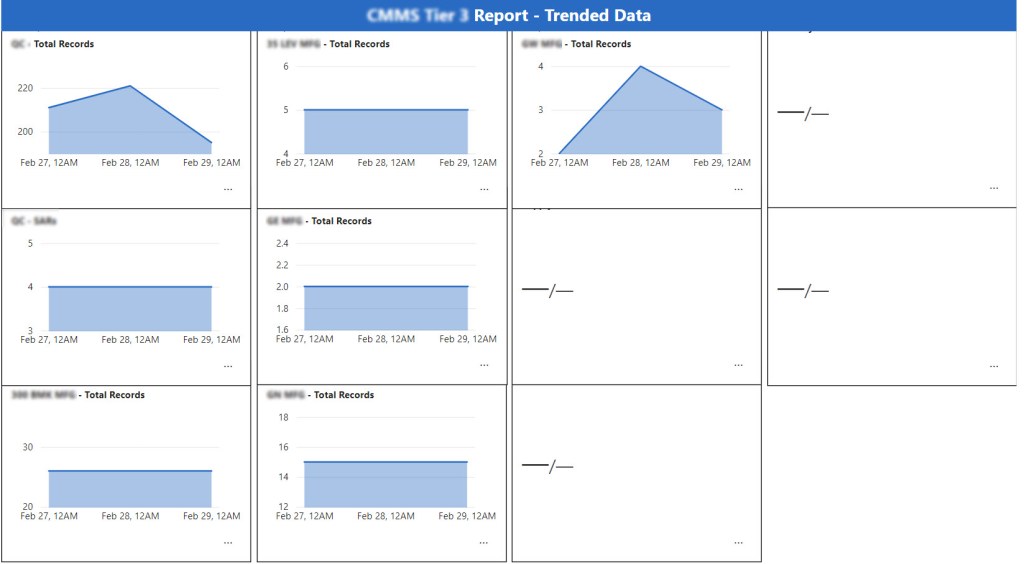
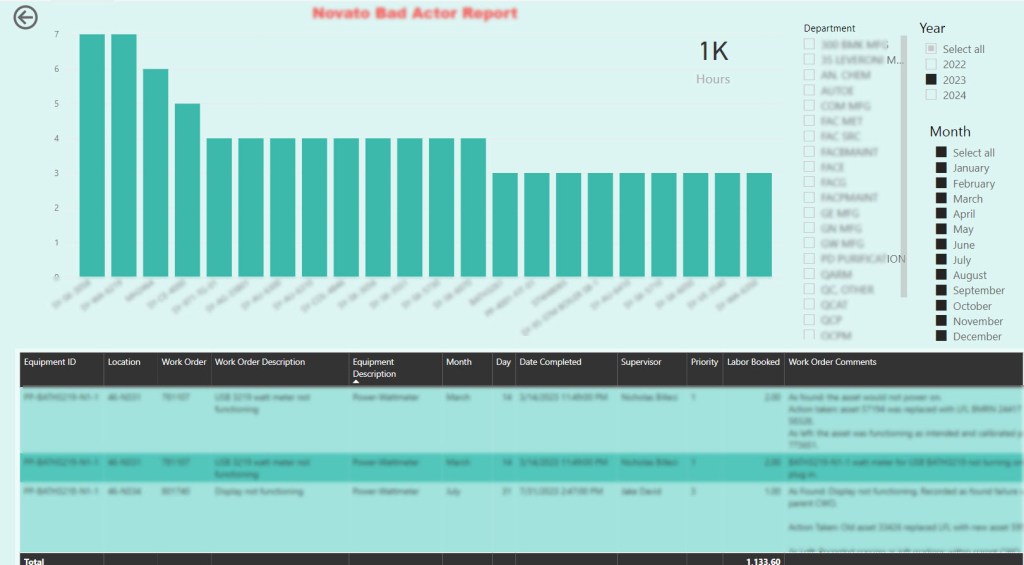
Report displays historic trends of record counts from previously shown ‘Tier 3 Leadership Report’, utilizing Scorecard and Metric features within Power BI.
Platform: Power BI with live connection to database.
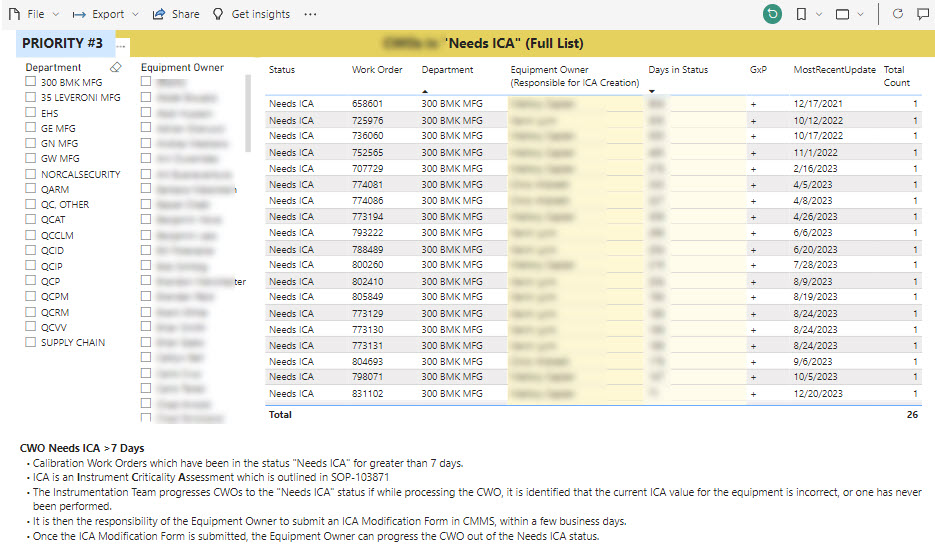
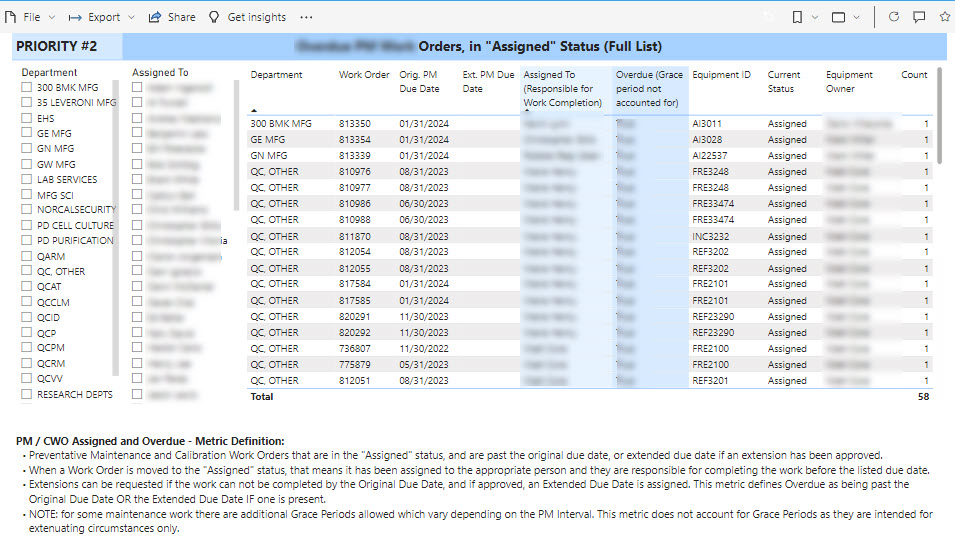
Report displays all records in a particular status, time spent in status, and person responsible for action. Key columns highlighted and color-coded, filters available for department and person.
Platform: Power BI with live connection to database.
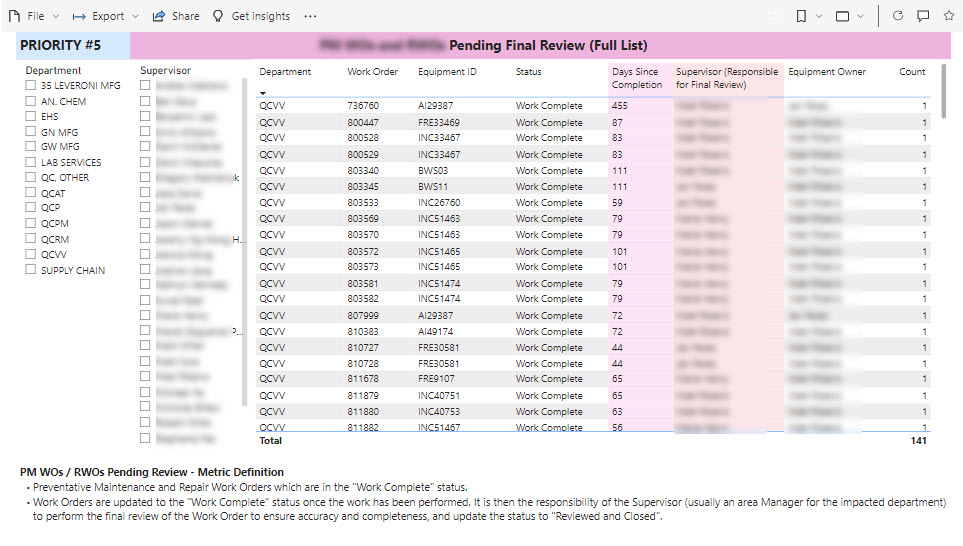
Report displays all records in a particular status, time spent in status, and person responsible for action. Key columns highlighted and color-coded, filters available for department and person.
Platform: Power BI with live connection to database.
Report displays all records in a particular status, time spent in status, and person responsible for action. Key columns highlighted and color-coded, filters available for department and person.
Platform: Power BI with live connection to database.
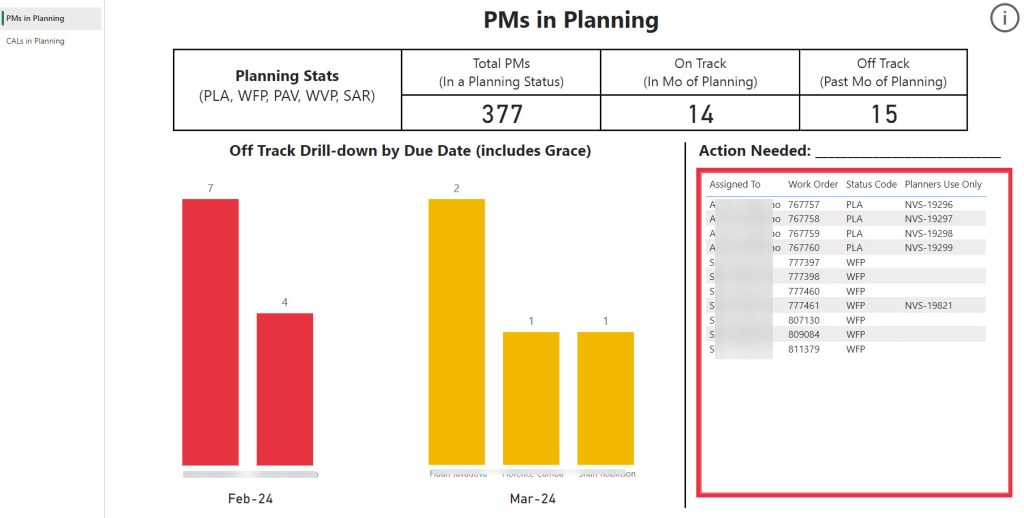
Report follows standard six-sigma format to identify records that are exceeding standard cycle times (off-track), then drills down into off-track records to allow for follow up action.
Platform: Power BI with live connection to database.
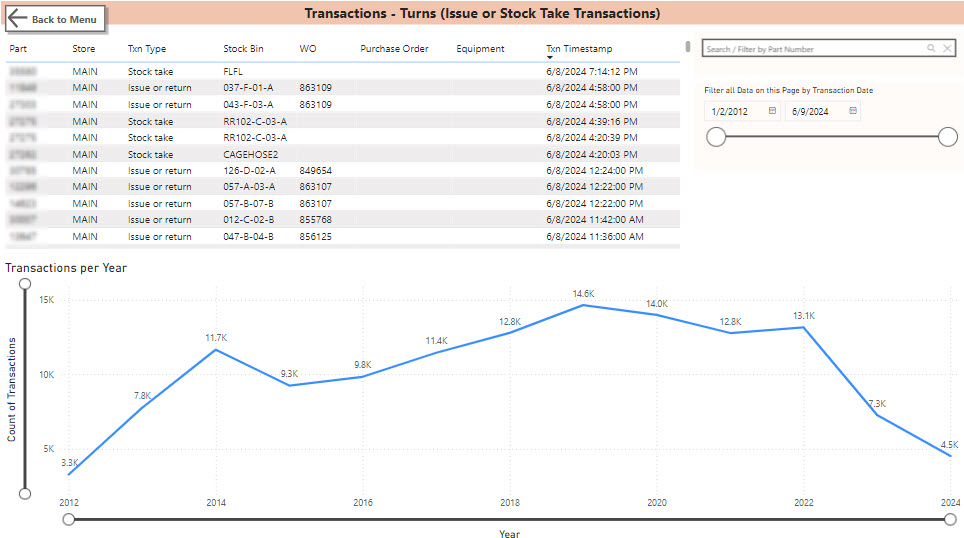
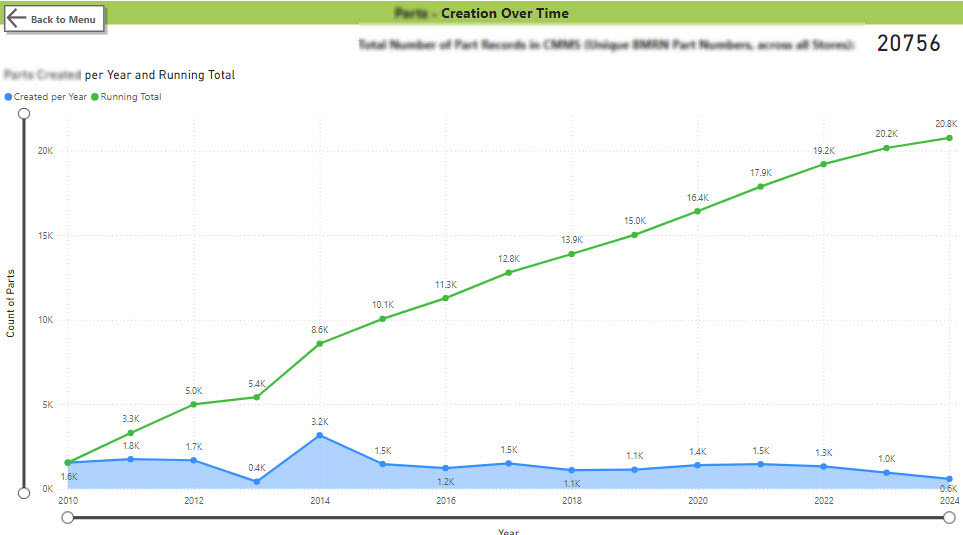
Report displays submission volume over time for a particular record type, filters available for key categories.
Platform: Power BI with live connection to database.

Report evaluates work requests and calculates the required due date which varies based on the record meeting any of eight criteria. Report then flags records as ‘On-track’, ‘Nearing Due’, or ‘Overdue’ to allow accurate prioritization of work.
Platform: Power BI with live connection to database.
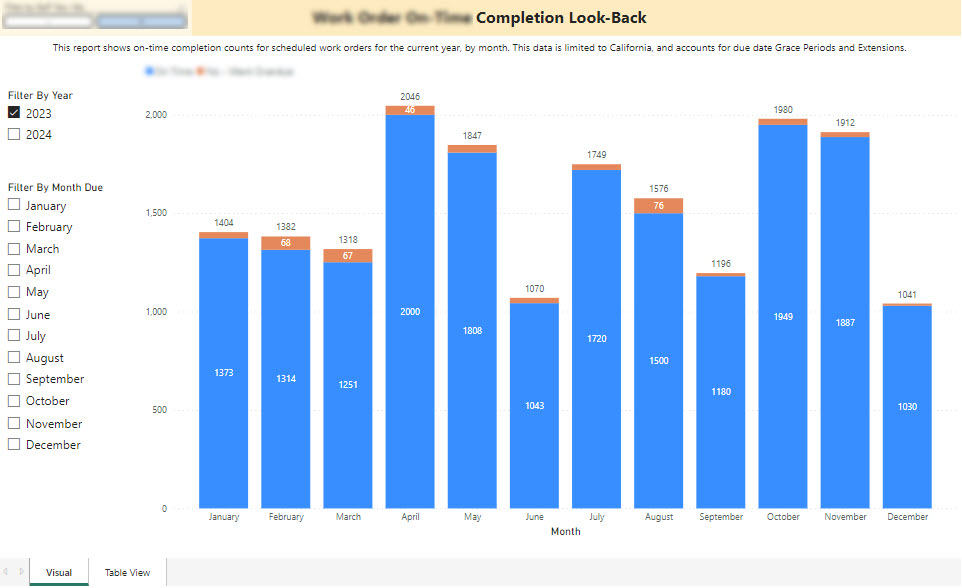
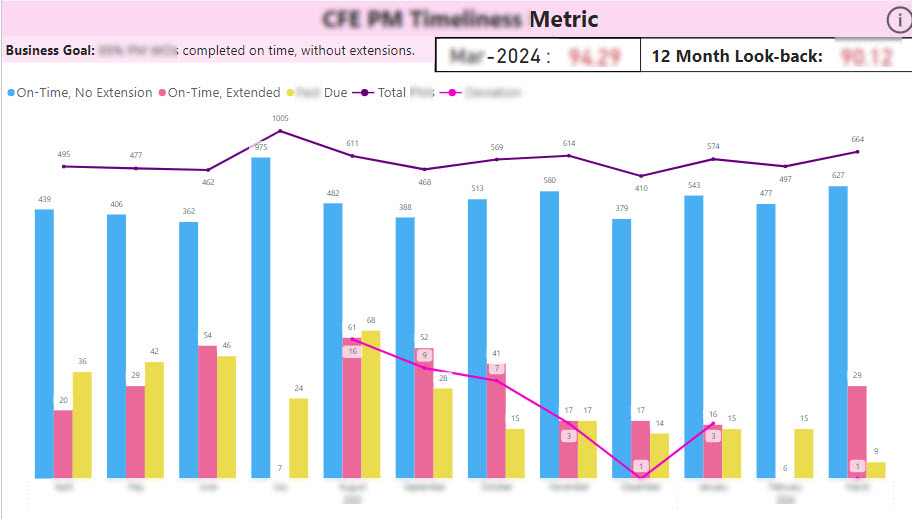
Report displays completion percentages for all work requests for current and prior year.
Platform: Power BI with live connection to database.

Platform: Power BI with live connection to database.

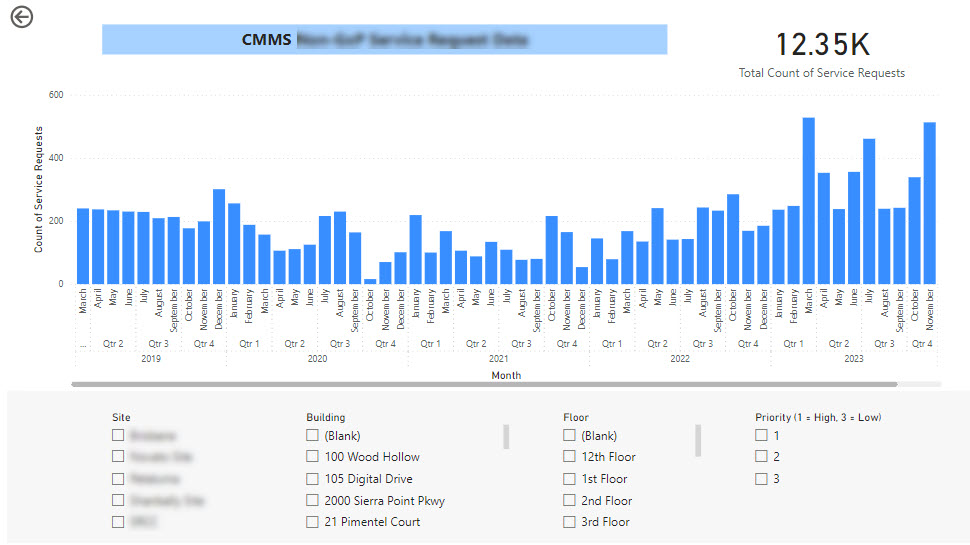
Report displays submission volume over time for a particular record type, filters available for key categories.
Platform: Power BI with live connection to database.
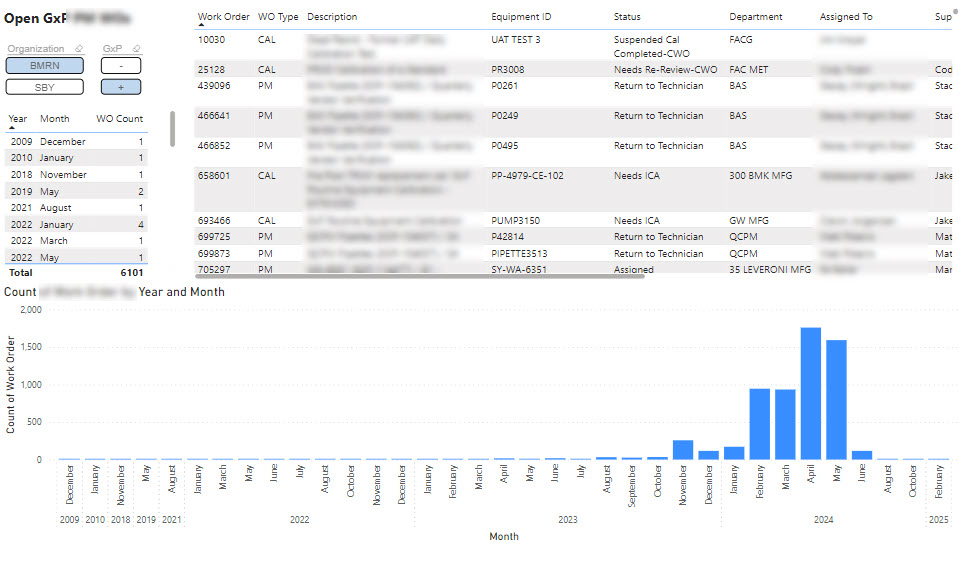
Report displays submission volume over time for a particular record type, filters available for key categories.
Platform: Power BI with live connection to database.
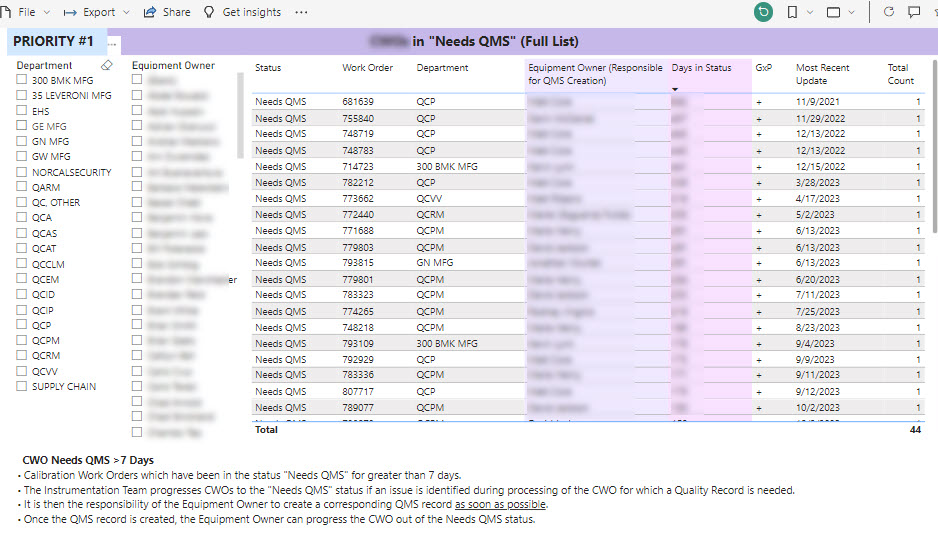
Report displays all records in a particular status, time spent in status, and person responsible for action. Key columns highlighted and color-coded, filters available for department and person.
Platform: Power BI with live connection to database.
Platform: Power BI with live connection to database.
